Introduction to ArcGIS, spatial data, data sources
Goals
Introduction to ArcGIS Pro, basic orientation in the user environment, adding data to the map and navigating the map
Basic terms
Software we will use
ArcGIS Pro, an advanced desktop geographic information system (GIS) developed by Esri, will be used during most of the classes. It allows users to create, edit, analyze, and visualize spatial data in various layers, including raster and vector maps, orthophotos, digital elevation models, and other datasets.
Users can create and edit attributes and geometry of features, perform advanced analysis, create and publish map layers, and create interactive map applications. The program also includes tools for visualizing data, creating map presentations, and sharing results with other users.
![]()
![]()
Note
Due to its high price, ArcGIS is mainly used in large companies and government agencies. Its open source alternative QGIS is more widespread in smaller companies (will be discussed at the end of the course). This information applies to the environment of the Czech Republic.
Spatial (GIS) data (vector)
Geographic Information System (GIS) generally uses any data containing spatial (location) information. A location can be represented not only by a combination of coordinates (X + Y, latitude + longitude, etc.), but also by, for example, an address (of arbitrary detail). In addition to the spatial information, any other information is usually added in the form of attributes in the attribute table.

The map contains 3 types of geometry:
(see the tabs)

| category | load [%] | cleaning/week |
|---|---|---|
| mix | 91 | 7 |
| plastic | 26 | 2 |
| mix | 14 | 5 |
| mix | 14 | 5 |
| paper | 58 | 2 |

| class | cars | trucks | length |
|---|---|---|---|
| street C1 | 1 | yes | 164,21 |
| street C3 | 1 | no | 621,5 |
| street C4 | 0 | no | 32,24 |
| street C1 | 1 | no | 495,01 |
| street C3 | 0 | no | 221,49 |

| category | administrator | status |
|---|---|---|
| public | Municipality | OK |
| public | Company Inc. | OK |
| restricted | Company Inc. | OK |
| restricted | Municipality | !alert! |
| residential | private | OK |
Save spatial data: Data can be stored in many different ways. There are many different data formats, but to start with, here are some basic ones.
- Shapefile: a format from Esri with a mostly open specification. It contains the geometry and properties (attributes) of spatial features, probably the most widely used at present, although it has many disadvantages and is somewhat outdated from today's point of view. One of the characteristics of the format is mandatory division into multiple files (
.shp,.shxand.dbf, possibly other optional), which brings difficulties when moving, copying, etc. - Geodatabase (GDB): the native data structure of the ArcGIS system - the primary data format for data management and editing, it contains a collection of datasets of various types (vector, raster and others) and can also store data integrity (domains, subtypes, etc.) or topology
- GeoJSON: an open standard representing vector data and associated attributes, based on the
JSONformat and is therefore user-readable and widely used - GML / KML: similar to GeoJSON - an open standard representing vector data and associated attributes, based on the
XMLformat, thus again user-readable - GeoPackage (GPKG): relatively new format of the OGC standard, supports both vector and raster data, overcomes many limitations of the
Shapefileformat (e.g. it is only 1 file), default format of QGIS - CSV: although not a format directly intended for spatial data, it is often used as an exchange format, the file contains only attributes
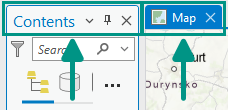
Contents
Starting and basic orientation in the program
At launch, the license is verified through the affiliation to the organization (CTU in Prague) - by logging in to the university account. The address (URL) for CTU is ctuprague.maps.arcgis.com - then an automatic redirection to the university login page (in the format username@cvut.cz and password to KOS) takes place.

The user interface of the program consists of three basic elements:
| RIBBON | menu of program functions (element identical to other programs, e.g. Microsoft Word), menu changes contextually according to user actions |
| PANE | panels and function properties, many functions trigger opening their own Panel, through which the function is controlled, e.g. Map Contents, Symbology |
| VIEW | a window with a map (2D) or a scene (3D) |
Další zdroje:
Adding data to the map
Creating a map: Insert New Map

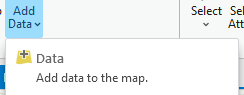
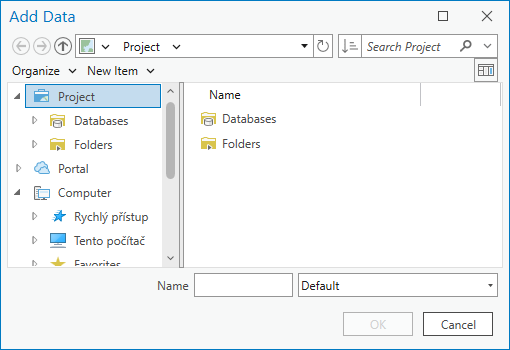
Adding data to the map (lokálně uložených): Map → Add Data → Data → vybrat soubor...

![]()
![]()
To avoid having to go through the directory structure each time to browse the data, it's a good idea to join the data directories to the project.
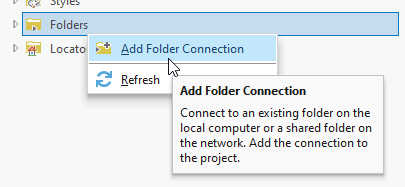
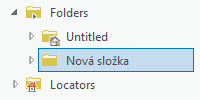
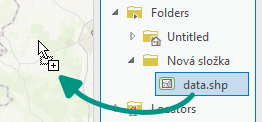
Connecting a directory to a project: in the Catalog Pane ( View → Catalog Pane ) right click on "Folders" choose Add Folder Connection → insert or select a path... → drag & drop the data from the folder into the Map View
![]()
![]()
![]()
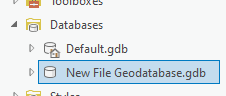
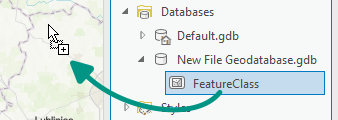
...the same can be done with a geodatabase. The geodatabase stores data more efficiently, but you can't store anything in it.
Connecting the geodatabase to the project: in the Catalog Pane ( View → Catalog Pane ) right click on "Databases" choose Add Database → insert or select a path to a geodatabase... → drag & drop the data from the folder into the Map View
![]()

![]()
![]()
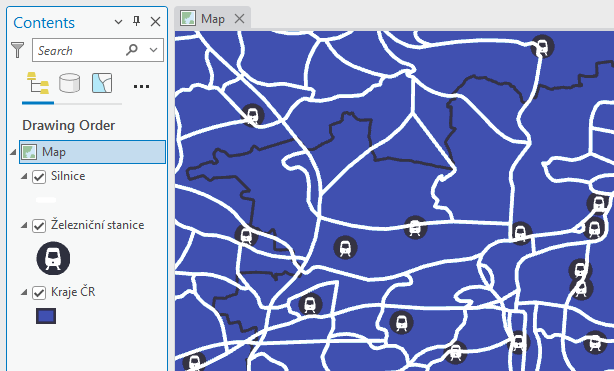
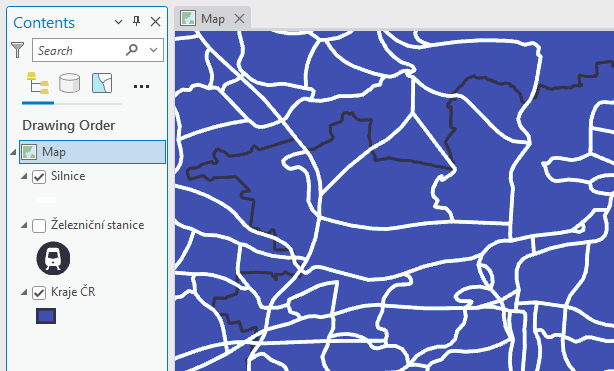
Layer order: The map content (Contents Pane) shows all layers contained in the map. The visibility of each layer can be switched with the checkbox on the left. By changing the order of the layers in the table of contents, the order in which they are rendered in the map is changed.

![]()
![]()
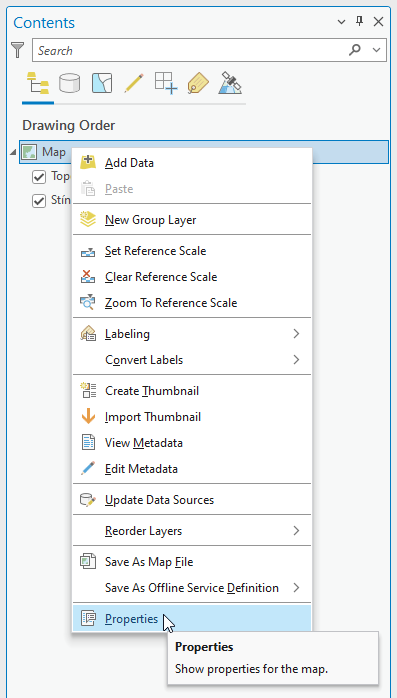
Nastavení (vlastnosti) mapy: V Contents Pane (Obsah) přes pravé tl. myši na název mapy vybrat Properties
![]()
![]()

For start, these items are of interest:
-
Tab General
- Name
- Reference scale: Fixes the size of the map symbology for the specified scale. Map reference scales
- Rotation: Map rotation angle
-
Tab Coordinate systems
- Information about the map display coordinate system (separately for position and elevation).
- WARNING, if the coordinate system of the inserted data differs from the map display system, the data is temporarily converted to the map display coordinate system. However, this is an On-the-fly transformation, which is simplified for some coordinate system combinations, and the data may not relate to each other correctly. This situation is not recommended as it can produce inaccurate results for map visualization and data analysis. More information
Where to get data
Locally stored files: access via system path, e.g.:
Data downloadable from the web: download from any source to a local disk in the form of files, same access as with locally stored files (see above)
Connecting streaming data: will be part of future exercises
- connection of data services via URL, does not require manual local storage, there are multiple standards for providing these services
Map controls
Explore Tool: Panning Movement in the map and pop-ups, see Fig.
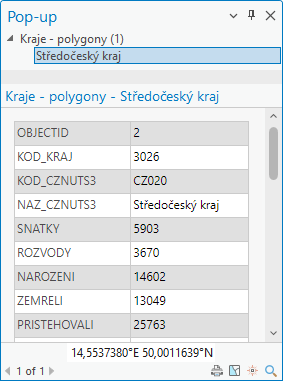
- Pop-up: It is one of the basic elements of the graphical environment of GIS applications. Its (most common) purpose is to provide a quick preview of information about a given feature by clicking on its geometry. However, the form of the window is configurable and the editing tools very variable. By default, the pop-up displays a listing of attributes in table form (Figure). Pop-ups
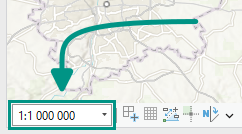
- Map scale: Indicates the size of the map features compared to their size in reality. In the corner of the map window (fig.) you can select predefined values from the drop-down menu or set any custom value. Map scales and scale properties

![]()

![]()
![]()
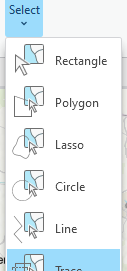
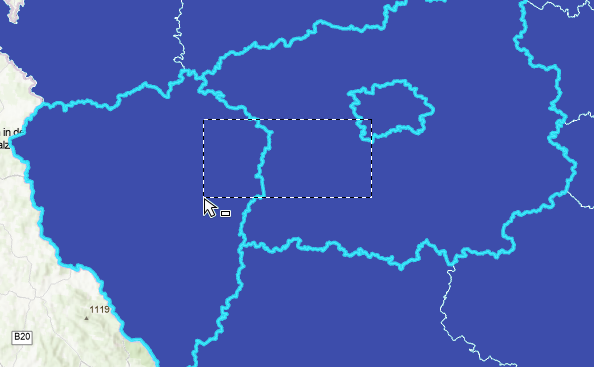
Select Tool: Panning the map and selecting features interactively (using cursor). To deselect (clear selection), see Fig.
- Add features to selection:
Shift + click - Remove features from selection:
Ctrl + click

![]()
![]()
![]()

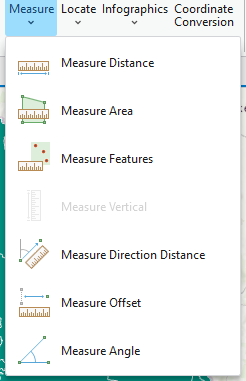
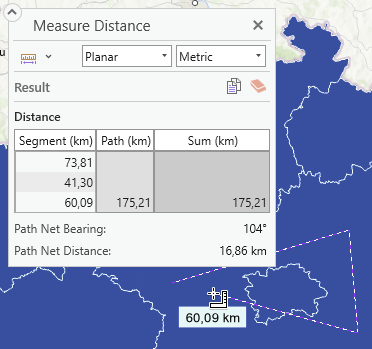
Measure Tool: Interactive measurement of distances, angles, etc.

![]()
![]()
Additional resources:
Attribute table
The attribute table is a supplement to the spatial data – it enriches each element (geometry) with additional information (called attributes). This information is crucial for GIS work, because geometry alone (without attributes) does not give us much information. The attribute table is therefore part of every (vector) layer.
The table contains columns - called fields, and rows - called records. Each element thus contains the values of all attributes - see the example below.